Data binding/Data mapping
The PlotlyJS Visual for Power BI provides powerful ways to connect your data to chart properties. This process is called data binding or data mapping. Understanding how it works allows you to create robust, reusable, and complex visualizations.
There are two main ways to bind data:
- Standard Data Binding: The default method used by the Chart Studio editor. It's straightforward and covers most use cases.
- Advanced Data Binding with Handlebars.js: A flexible method for advanced users to dynamically generate JSON configuration from your data.
Standard Data Binding
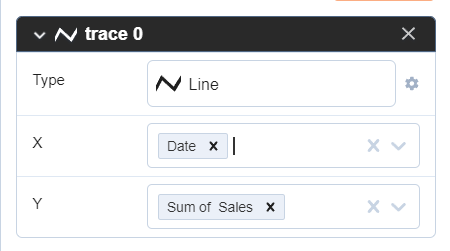
When you assign data columns to a trace in the Chart Studio editor, the visual automatically performs data binding.
This process involves two key actions:
- Writing Data: The actual data values from your Power BI columns are written into the corresponding arrays in the trace object (e.g.,
x,y,labels,marker.color). - Storing References: To maintain the link to the Power BI data source for refreshes and re-mapping, the visual stores references to the column names in two places:
- In properties ending with
src(e.g.,xsrc,labelssrc,colorsrc). - Inside a
meta.columnNamesobject.
- In properties ending with
Here is an example of a trace object in the JSON document after assigning several columns:
"data": [
    {
        "type": "scatter",
        "mode": "markers",
        "x": [
            161263.5,
            168552,
            470673.5,
            172178,
            153139
        ],
        "xsrc": "Units Sold",
        "labels": [
            "Channel Partners",
            "Enterprise",
            "Government",
            "Midmarket",
            "Small Business"
        ],
        "labelssrc": "Segment",
        "marker": {
            "symbol": [
                 "triangle-ne",
                 "circle",
                 "square",
                 "triangle-sw",
                 "cross"
            ],
            "symbolsrc": "Shape",
            "color": [
                 "#118DFF",
                 "#12239E",
                 "#E66C37",
                 "#6B007B",
                 "#E044A7"
            ],
            "colorsrc": "Country (Color)"
        },
        "meta": {
            "columnNames": {
                "values": "Units Sold",
                "labels": "Segment",
                "marker": {
                  "symbol": "Shape",
                  "color": "Country (Color)"
                 }
            }
        }
    }
]
You can see that labels and values arrays contain data from Power BI. You can also see that the meta object has a list of used columns in the columnNames object.
Also, there are three other properties xssrc, labelssrc, symbolsrc (inside marker object) with column names from Power BI to bind data from Power BI to the Plotly.js library.
Also, there are three other properties xssrc, labelssrc, symbolsrc (inside marker object) with column names from Power BI to bind data from Power BI to the Plotly.js library.
Each time when the user loads chart JSON into the visual, the visual checks the columns from columnNames and <property name>src to ensure that the visual has those columns filed well in the bucket. If the visual doesn’t find a match, it displays a mapping view to remap columns to the property.
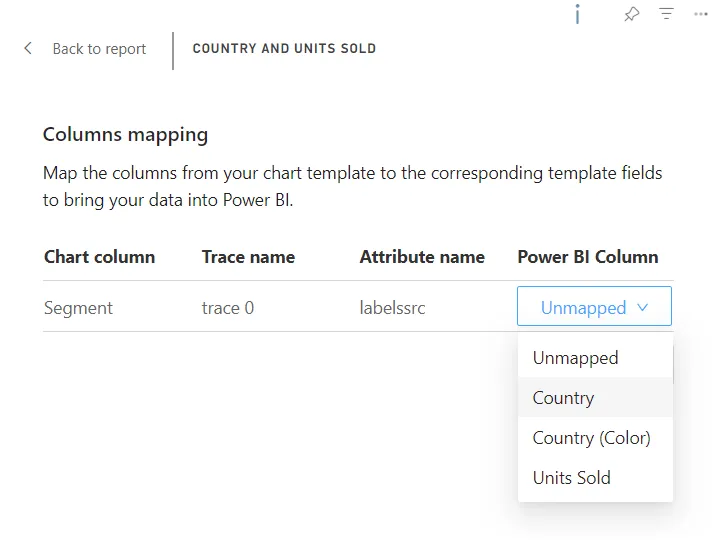
After selecting the new columns for the chart, the visual loads the chart view or Chart studio to continue editing the chart JSON.
Handlebars.js template inserts
The visual support Handlebars.js templates inserts. It allows to user generate JSON configuration by using templates and bind data to JSON configuration in advanced approach.
The template inserts are JSON properties with keys that starts by HBT<n>, where <n> is an number. And values are template strings.
column helper
The helper returns an array of values for the given single column name.
{
    // ...
    HBT1: 'x2: {{{ column "Country" }}}',
    // ...
}
The helper returns x2: ["USA", "Canada", "Mexico"] if the column Country has values USA, Canada, Mexico.
select helper
The helper returns an array of object with values for the given column names.
Example:
{
    // ...
    HBT1: 'x2: {{{ select "Country", "City" }}}',
    // ...
}
The helper returns
{
    // ...
    x2: [{Country:"USA", City:"New York"}, {Country:"Canada", City:"Toronto"}, {Country:"Mexico", City:"Mexico City"}]
    // ...
}
If the columns Country and City have values USA, Canada, Mexico and New York, Toronto, Mexico City respectively.
map helper
The helper returns an values of given property from for the given array of objects.
Example:
{
    // ...
    HBT1: 'x2: {{{ map "Country" (select "Country", "City") }}}',
    // ...
}
Return array of values of Country column:
{
    // ...
    "x2": ["USA", "Canada", "Mexico"]
    // ...
}
Where (select "Country", "City") is helper that returns array of objects:
[
    { "Country": "USA", "City": "New York" },
    { "Country": "Canada", "City": "Toronto" },
    { "Country": "Mexico ", "City"}
]