Tooltips
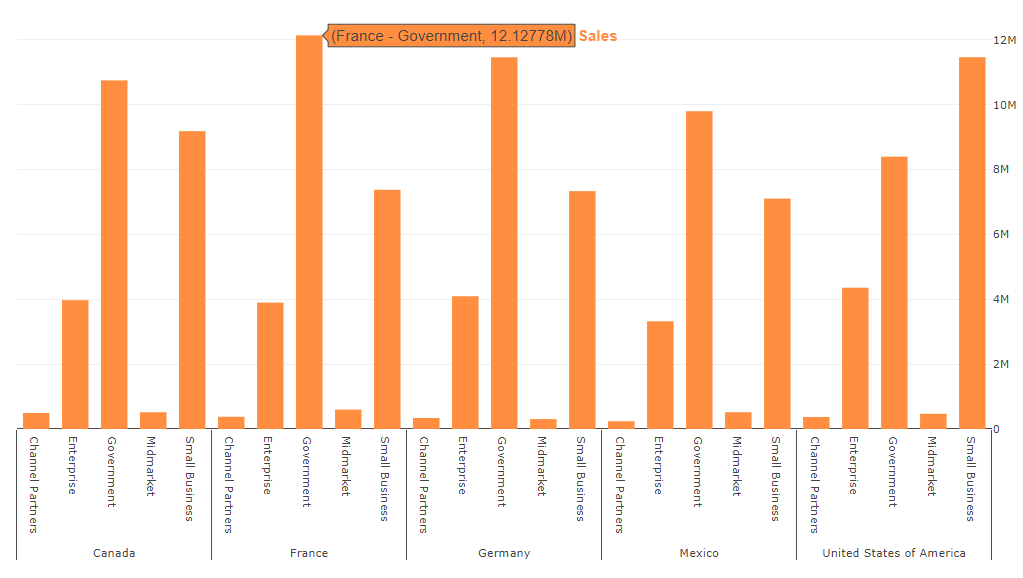
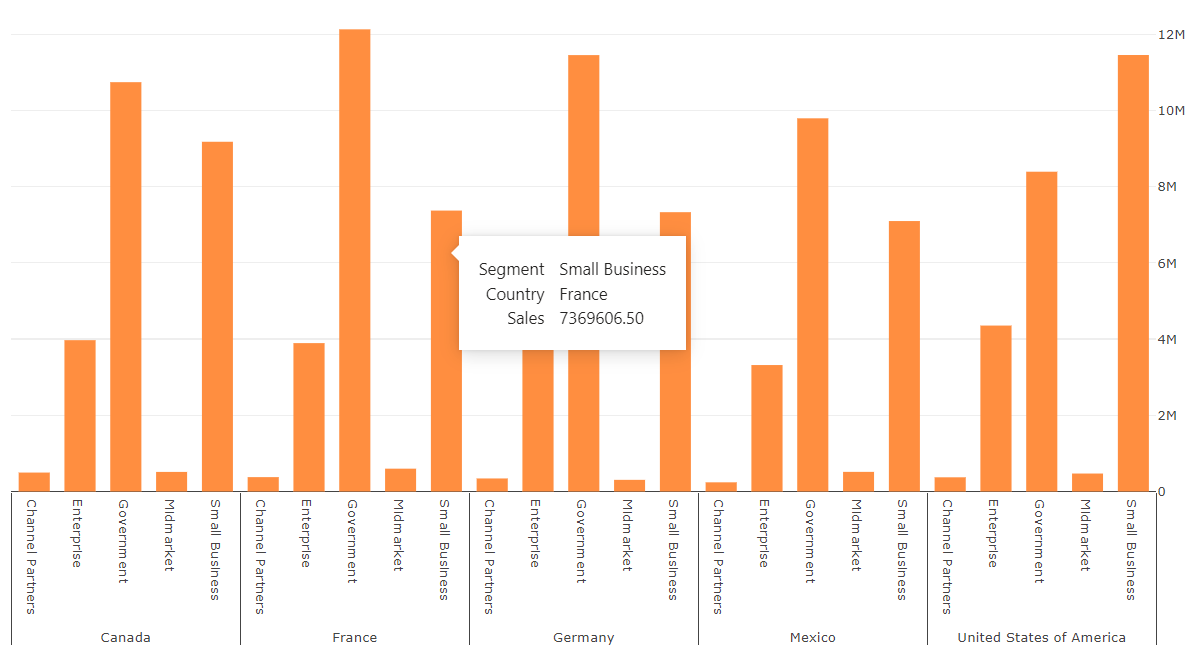
Tooltips are an elegant way of providing contextual information and detail to data points on a visual.
The visual version 1.6.0 or above is required
Plotly.JS tooltips
By default, plotly.js shows tooltips for traces on mouse hover over datapoints. There are columns names and correspond to datapoint values.

Switch on "Plotly.js tooltips" in visual formatting panel to use tooltips provided by Plotly.js library.

hoverformat
Provides format options for axes. Example:
{
    "data": [],
    "layout": {
        "xaxis": {
          "hoverformat": "%y/%m/%d",
          "range": [
            "2013-09-01",
            "2014-12-01"
          ],
          "autorange": true,
          "type": "date"
        }
    }
}
provides formatting option for x axis as %y/%m/%d for date format.
For numbers, see D3.js documentation
hovertemplate
Template string used for rendering the information that appear on hover box. Note that this will override hoverinfo. Variables are inserted using %{variable}, for example "y: %{y}" as well as %{xother}, {%_xother}, {%_xother_}, {%xother_}. When showing info for several points, "xother" will be added to those with different x positions from the first point. Read details in documentation
Example:
{
    "data": [
        {
            "type": "scatter",
            "hovertemplate": "<i>Price</i>: $%{y:.2f}<br><b>X</b>: %{x}<br><b>%{text}</b>",
        }
    ]
}
Read more about Plotly.js tooltips in official documentation
Power BI Tooltips
The visual supports tooltips provided by Power BI also. The feature requires purchase the license in Appsource.
Currently, the following Power BI environments don't require license purchasing for the PlotlyJS visual feature:
- Embedded - Publish To Web, PaaS embed
- National/Regional clouds (Depends on general support for transactability in national/regional clouds)
- RS Server
- Exporting (PDF\PPT) using REST API
Read about how to purchase a visual license and assign the license to users.
Read more about purchasing Power BI visuals in official documentation.

Switch on "Power BI tooltips" in visual formatting panel to use tooltips provided by Power BI visuals API.

The columns and properties of tooltip can be configured in powerbi config of the JSON file.
"powerbi": {
    "tooltipData": [
        {
            "columnIsHeader": true,
            "displayName": "Header text should be the first"
        },
        {
            "header": "Or another Custom header",
        },
        {
            "column": "Country"
        },
        {
            "column": " Sales",
            "format": "$.2f"
        },
        {
            "displayName": "Custom display of sales value",
            "column": " Sales",
            "format": "$.2f"
        },
        {
            "column": "Country",
            "displayName": "Custom text",
            "value": "your const value"
        },
        {
            "displayName": "Custom text 2",
            "value": "your const value 2"
        }
    ]
}
column property
Sets column for display value and data value from dataset
columnIsHeader proeprty
Sets column header as tooltip header
header proeprty
Sets custom constant value as tooltip header
format property
Sets formatting for numerical and date values
displayName property
Sets custom constant display name for tooltip row. The property override column header from dataset
value proeprty
Sets custom constant value for tooltip row